tourism
impact model
Tourism Impact Model (TIM) is an award-winning tool using real data to create an objective picture of the impact of tourism in a certain micro-location. It analyses different societal aspects: from environment, economy and culture to collaboration and produces an automatically generated report based on more than 300 indicators. By modelling the impact using different scenarios, it also acts as a digital twin of a tourist destination and allows data-driven strategic planning aligned with the UN Sustainable Development Goals.
TIM has already been validated in 27 destinations in Danube area (Austria, Slovenia…) and 6 destinations in Black Sea Area.
Awards:


Search for the true impact of Tourism
Local inhabitants, tourist service providers, authorities … every stakeholder has its own subjective perception of the reality. TIM brings real data in the perception of the impact of tourism to sharpen the real picture for everyone and allow data driven strategic planning.
The benefits for a destination
- Built-in transparency and inclusion of local inhabitants in strategic planning.
- Supervised collecting of data from various sources and their transformation into valuable information.
- Real picture of the whole spectrum of positive and negative impacts of tourism based on real data.
- Complex concepts made simple and understandable through visualisation of results and sets of recommendations for improvements.
- Dynamic real data simulations of possible scenarios for quick and competent response in all situations.
How it works
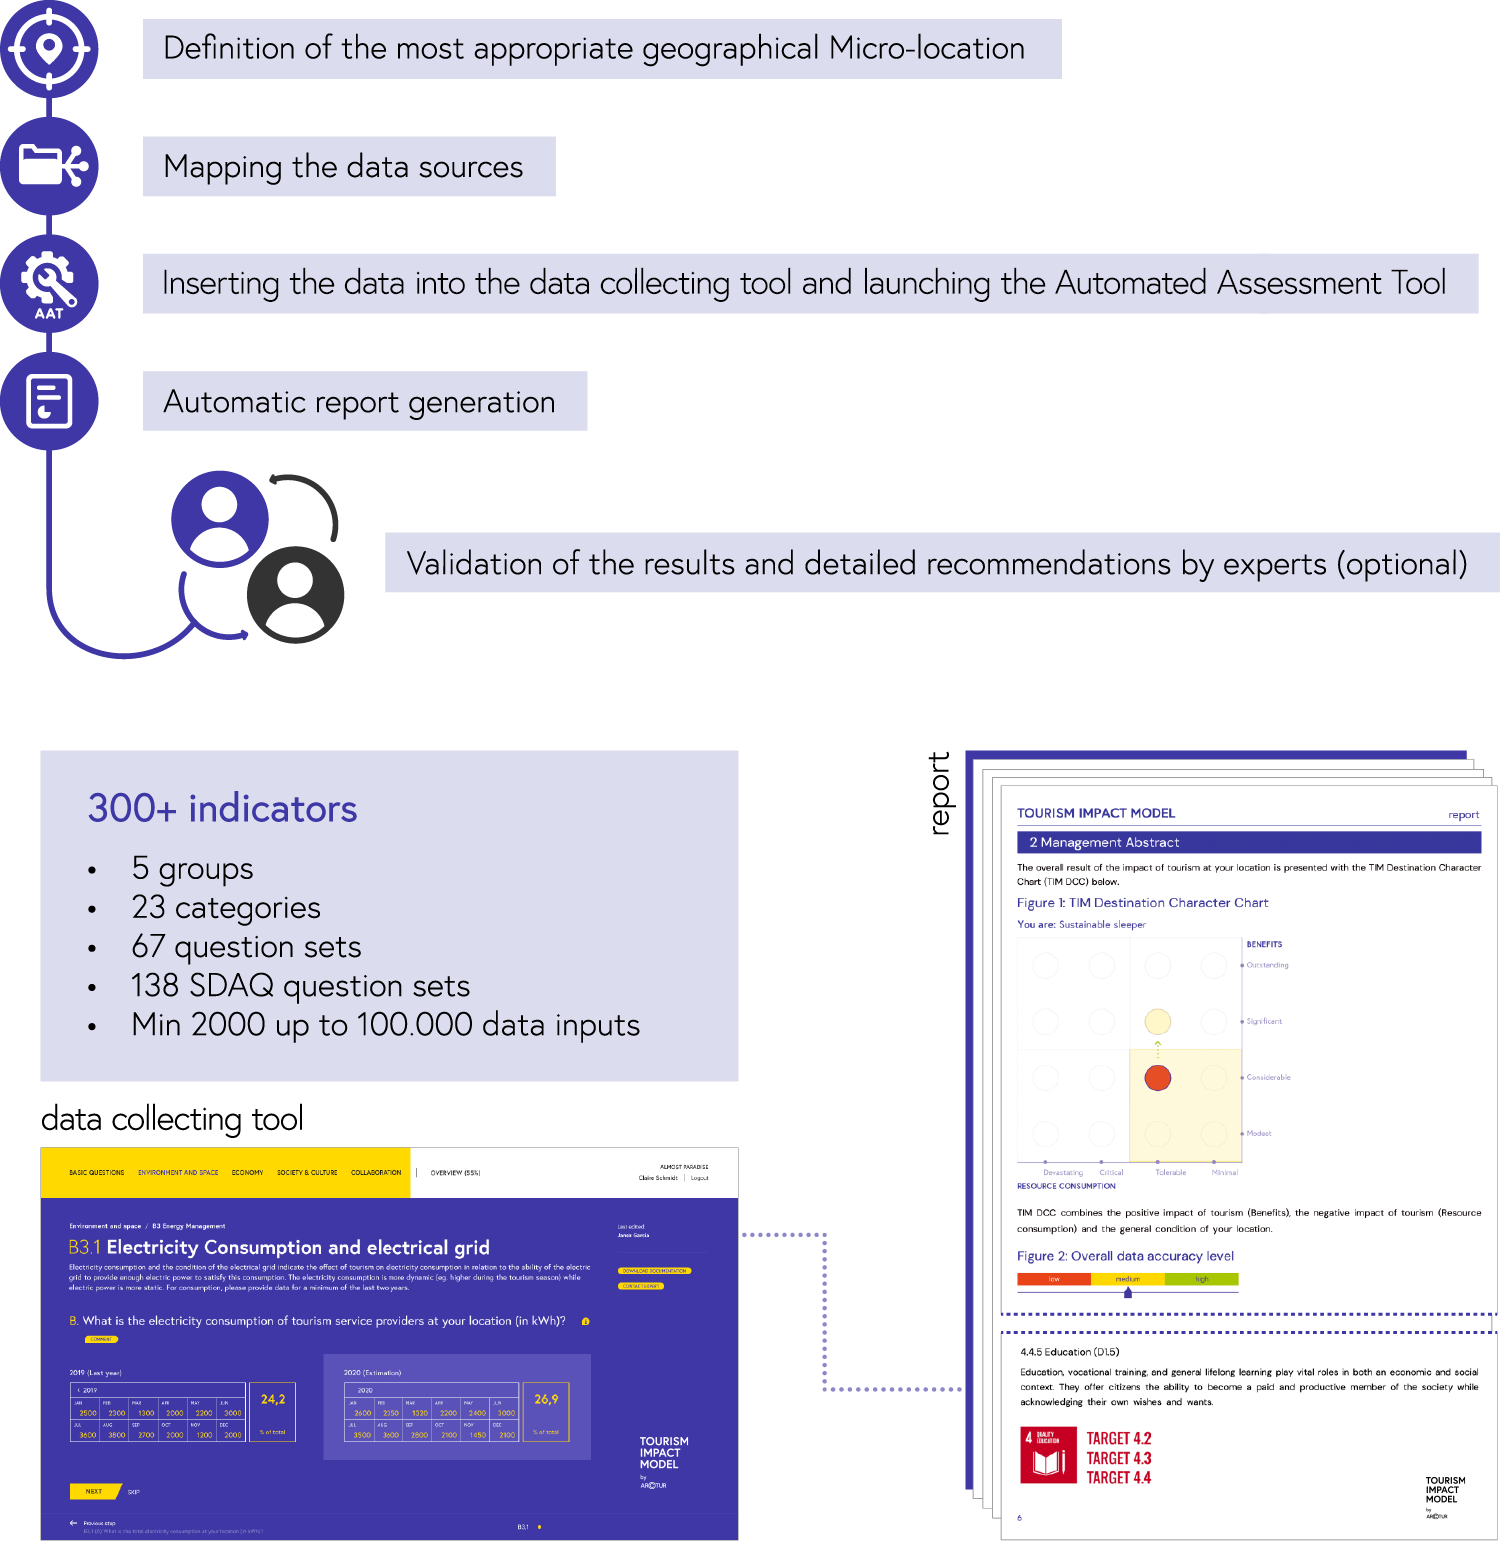
The process is supervised by certified TIM experts and includes the following steps:
Easy to understand results
Results are presented in a detailed report spanning over 100 pages. It is comprised of multiple indicators and graphs including the Destination Character Chart which enables easily comparable overall results.
Destination Character Chart™
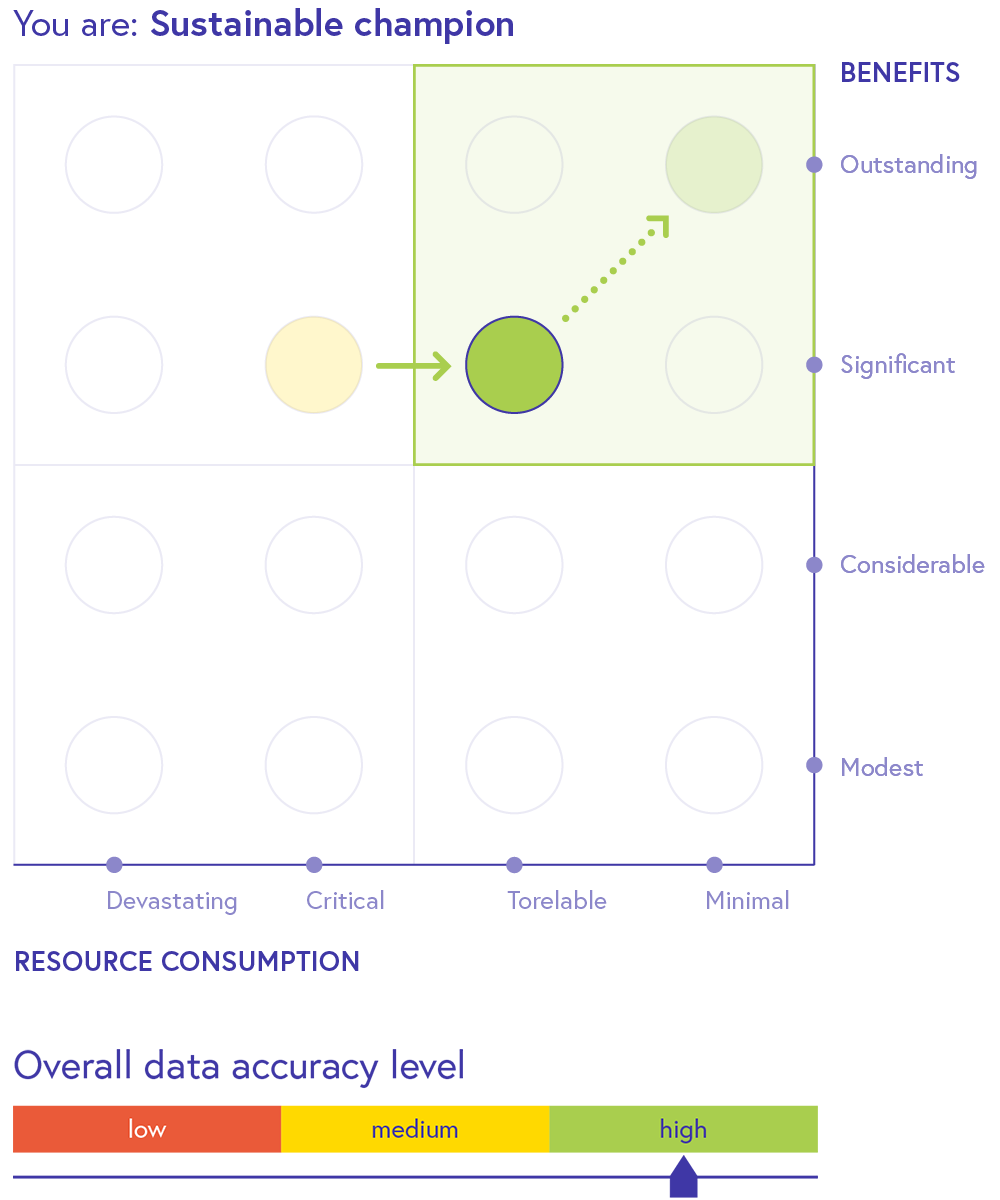
Destination Character Chart (DCC) is a tool for visualisation of the destination character, summarising values of hundreds of indicators grouped into a 3-dimensional matrix combining: Positive impact of tourism (Benefits), negative impact of tourism (Resource consumption) and General conditions of the destination. The main DCC is complemented by so called mini DCCs which visualise the results for individual sections. Each DCC (main and mini) is also accompanied by its data accuracy level presented by a graphic (picture 6).
1
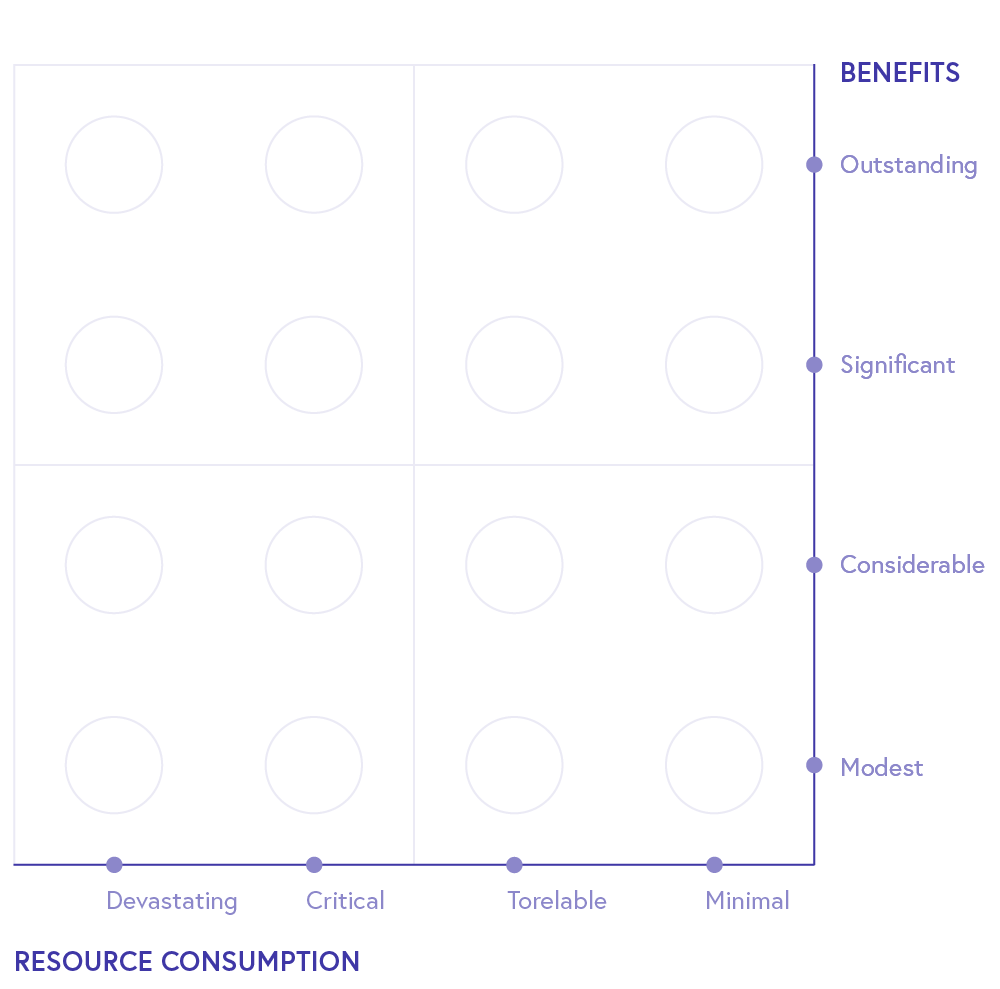
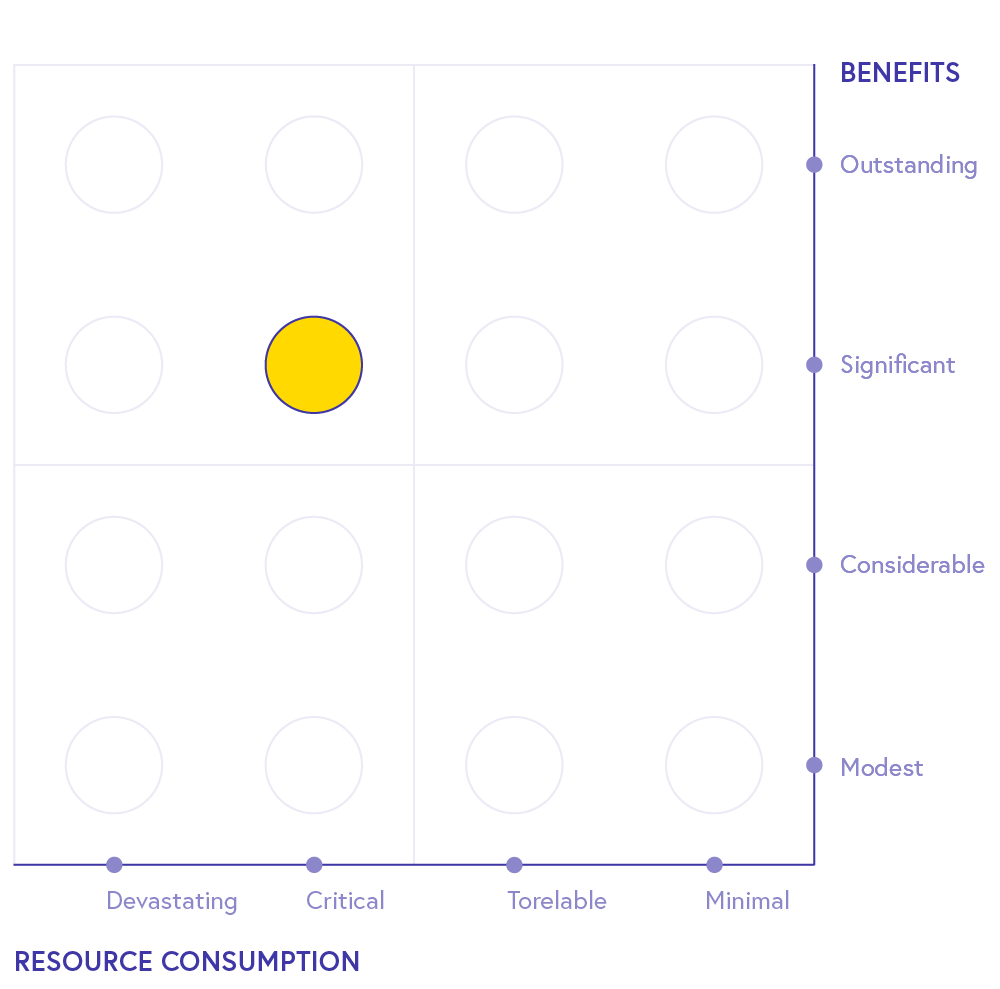
Benefits are represented on Y axis (from 1 to 4), Resource consumption on X axis (from -1 to -4), all together we have 16 (4×4) possible positions.
2
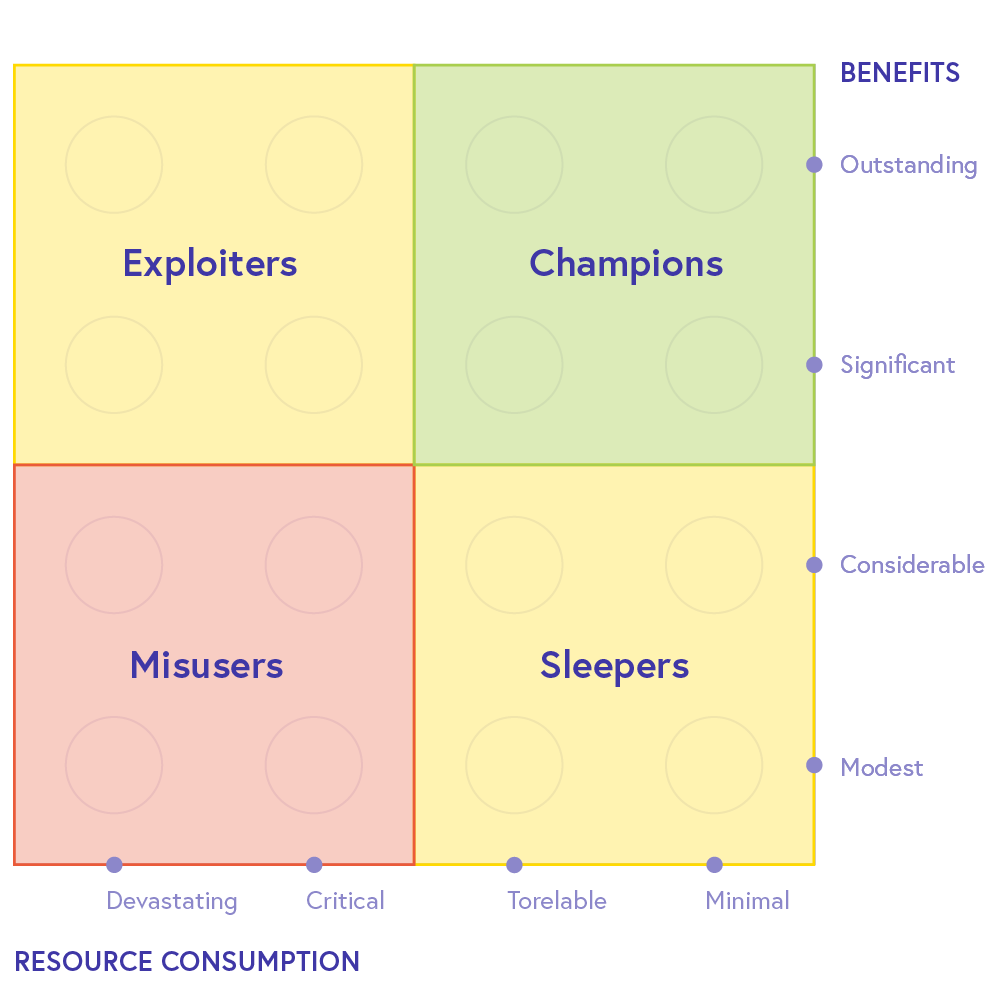
There are 4 different groups of primary characters, each containing 4 positions:
- Champions (high benefits, low resource consumption)
- Sleepers (low benefits, low resource consumption)
- Exploiters (high benefits, high resource consumption)
- Misusers (low benefits, high resource consumption)
3
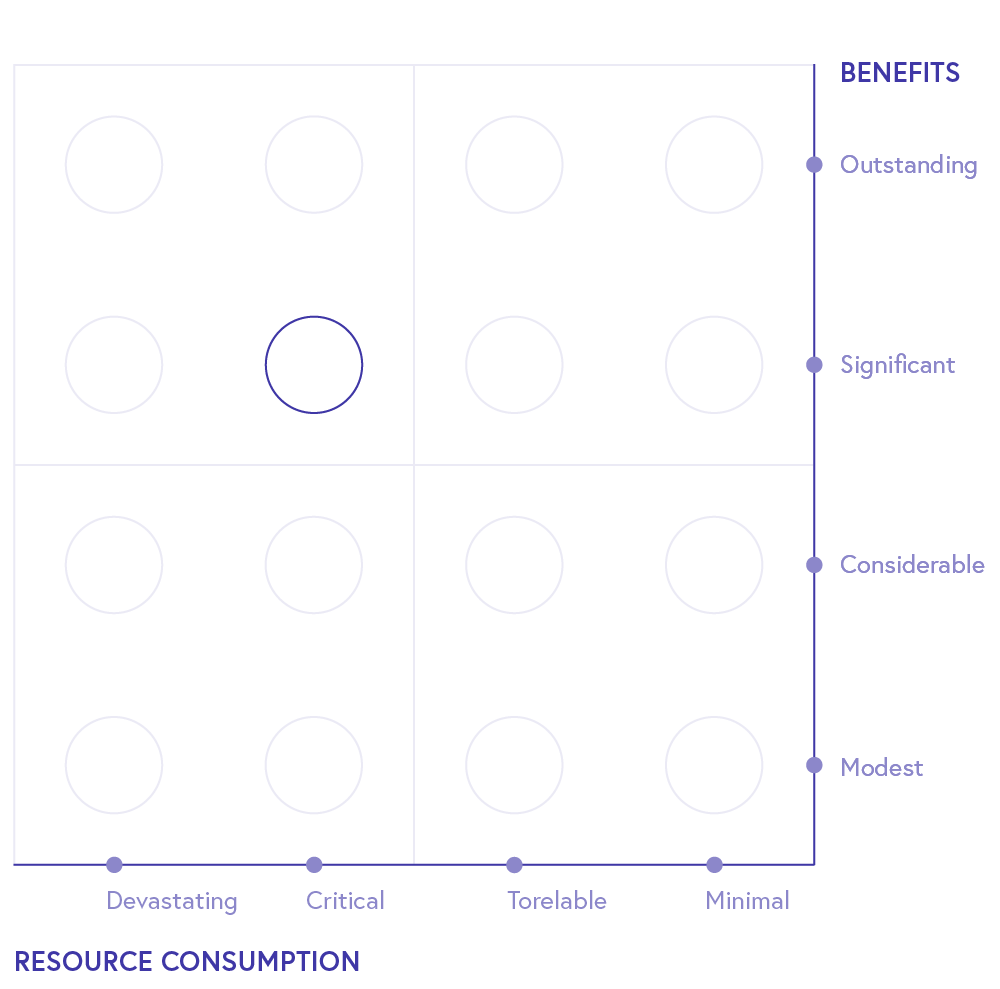
Each destination is placed in one of 16 positions according to the given answers
4
The third dimension, representing the General condition of the destination, is the colour of the position: it can be green (excellent), yellow (middle) or red (bad).
5
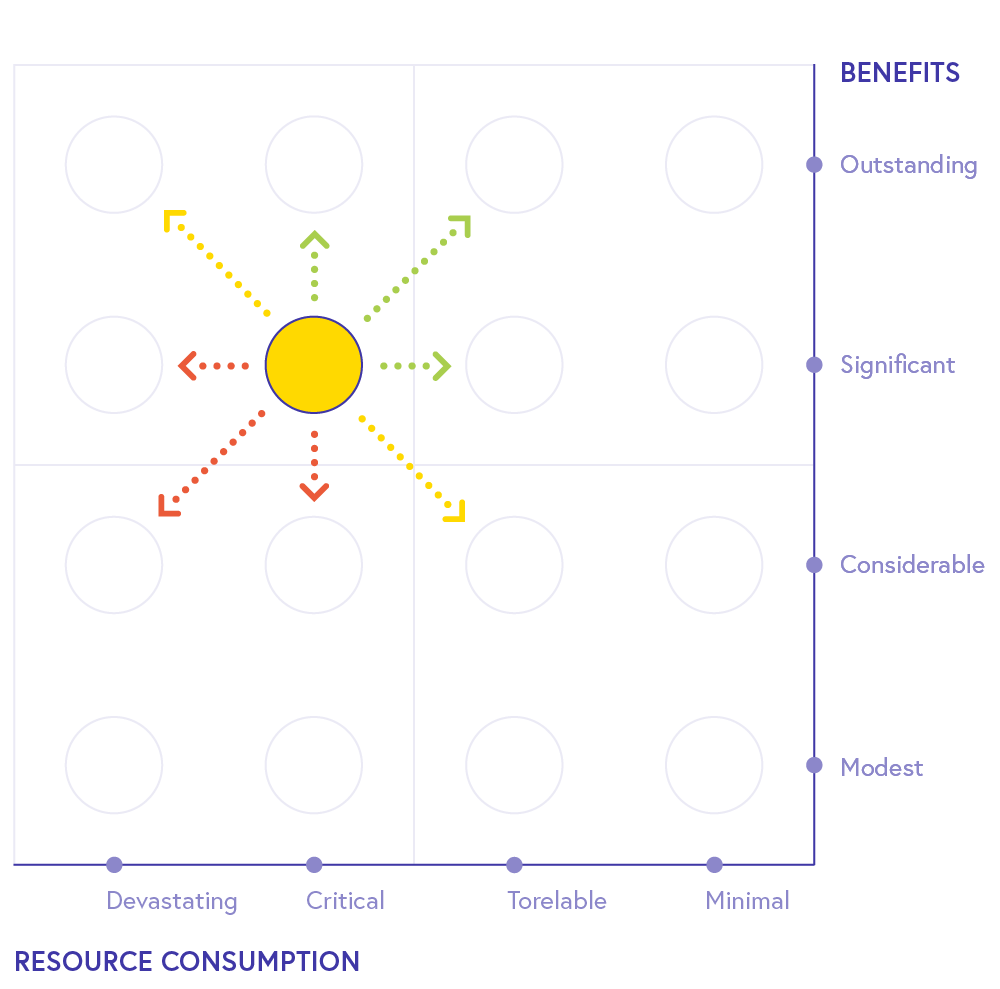
As many questions contain an additional answer where values for the near future are estimated, a trend where the specific destination is heading is presented in a form of a vector: the green arrows are good, heading towards the better positions (sustainable directions), yellow are neutral while red ones indicate bad impact and should be avoided.
6
The final result is a combination of the DDC graph alongside the overall data accuracy level.
DCC graph is presented on the 3-dimensional matrix (X, Y and colour) and a trend vectors, showing past position (if available from previous assessment) and the current trend of development (estimations for the future). The final name of the destination character is a combination of past and present positions, as well as trends.
For example:
Sustainable champion (low resource consumption and high benefits of tourism) with excellent general condition of the location. Trend: sustainable advancement from the past and also towards the future.
Data accuracy level is displayed next to DCC graphs. It consists of a three tiered scale which indicates the trust in the accuracy of the given data: low, medium or high. It is calculated based on the source, frequency of measurement and accuracy of the data.
Sustainable Development Goals
The 17 Sustainable Development Goals (SDGs) were adopted by all United Nations Member States in 2015 in order to move the world forward in a more sustainable manner. Each SDG is composed of numerous targets that more specifically define the goal.
Individual SDG targets are displayed next to conceptual segments and correspond to a certain idea presented in that section of the report.
Read more about UN’s SDGs.
Example:

Find more details here!
References
- Implementing TIM in Danube area (Interreg project)
- Tourism 4 Black Sea (EMFF project)
- First 3 pilot TIM destinations
We are searching for
- Tourist destinations, regions and countries worldwide to become TIM beta users,
- Tourism industry professionals to become certified TIM experts,
- Researchers to join our R&D team in the future development of TIM.
